AeroPoint Dashboard
One of Propeller's flagship hardware products is AeroPoints™. They act as ground control points in surveying, making sure that the digital models representing their site are consistently accurate.
Once powered on, this device connects to Propeller and uploads geospatial data to the AeroPoint dashboard. Users can then navigate to that page to download this data or run diagnostics on the state of their hardware. The dashboard, however, does not use the most suitable layout to visualise AeroPoint data. One of the issues raised by our customer success team was the inability to easily spot problematic AeroPoints and find remedies for them. This project was about utilising a more suitable layout that provides easier troubleshooting of the AeroPoints.
Company →
Role → Lead Designer
Timeframe → Designed in 2020
Team → Product Owner, Tech Lead, Two Engineers, and Two Designers (including myself)
Current Layout for AeroPoint Dashboard
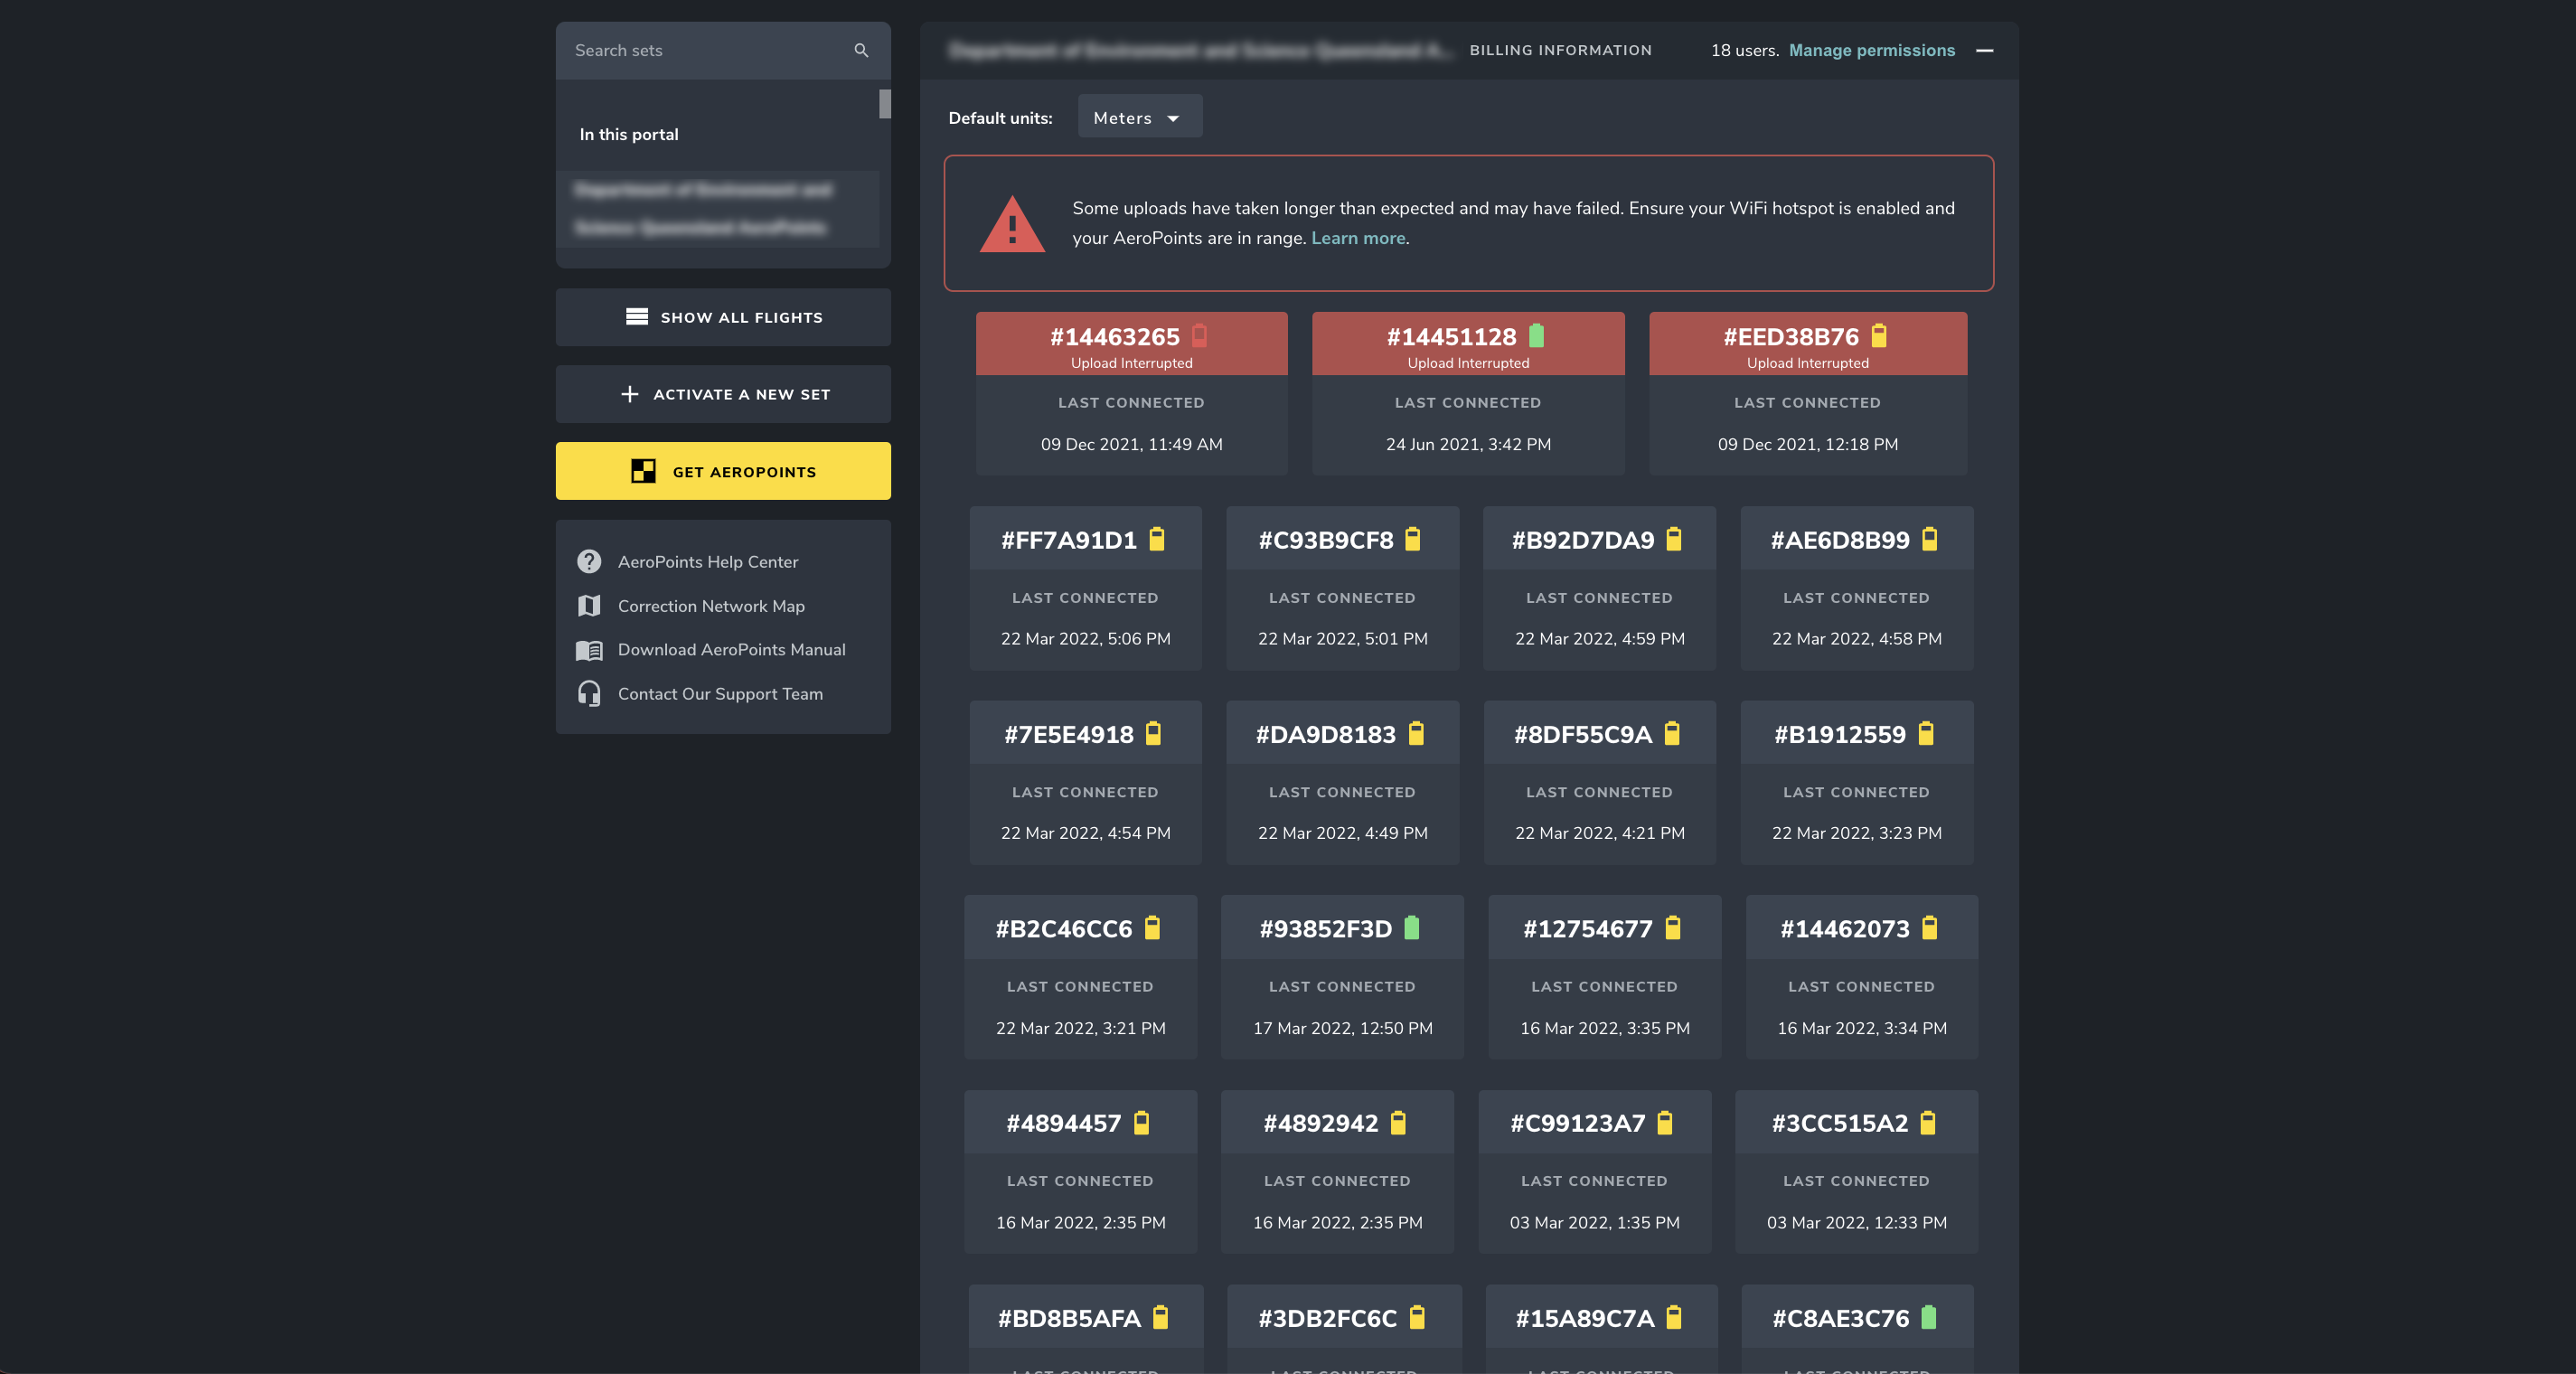
AeroPoints are displayed in a grid layout.
Proposed Layout for AeroPoint Dashboard
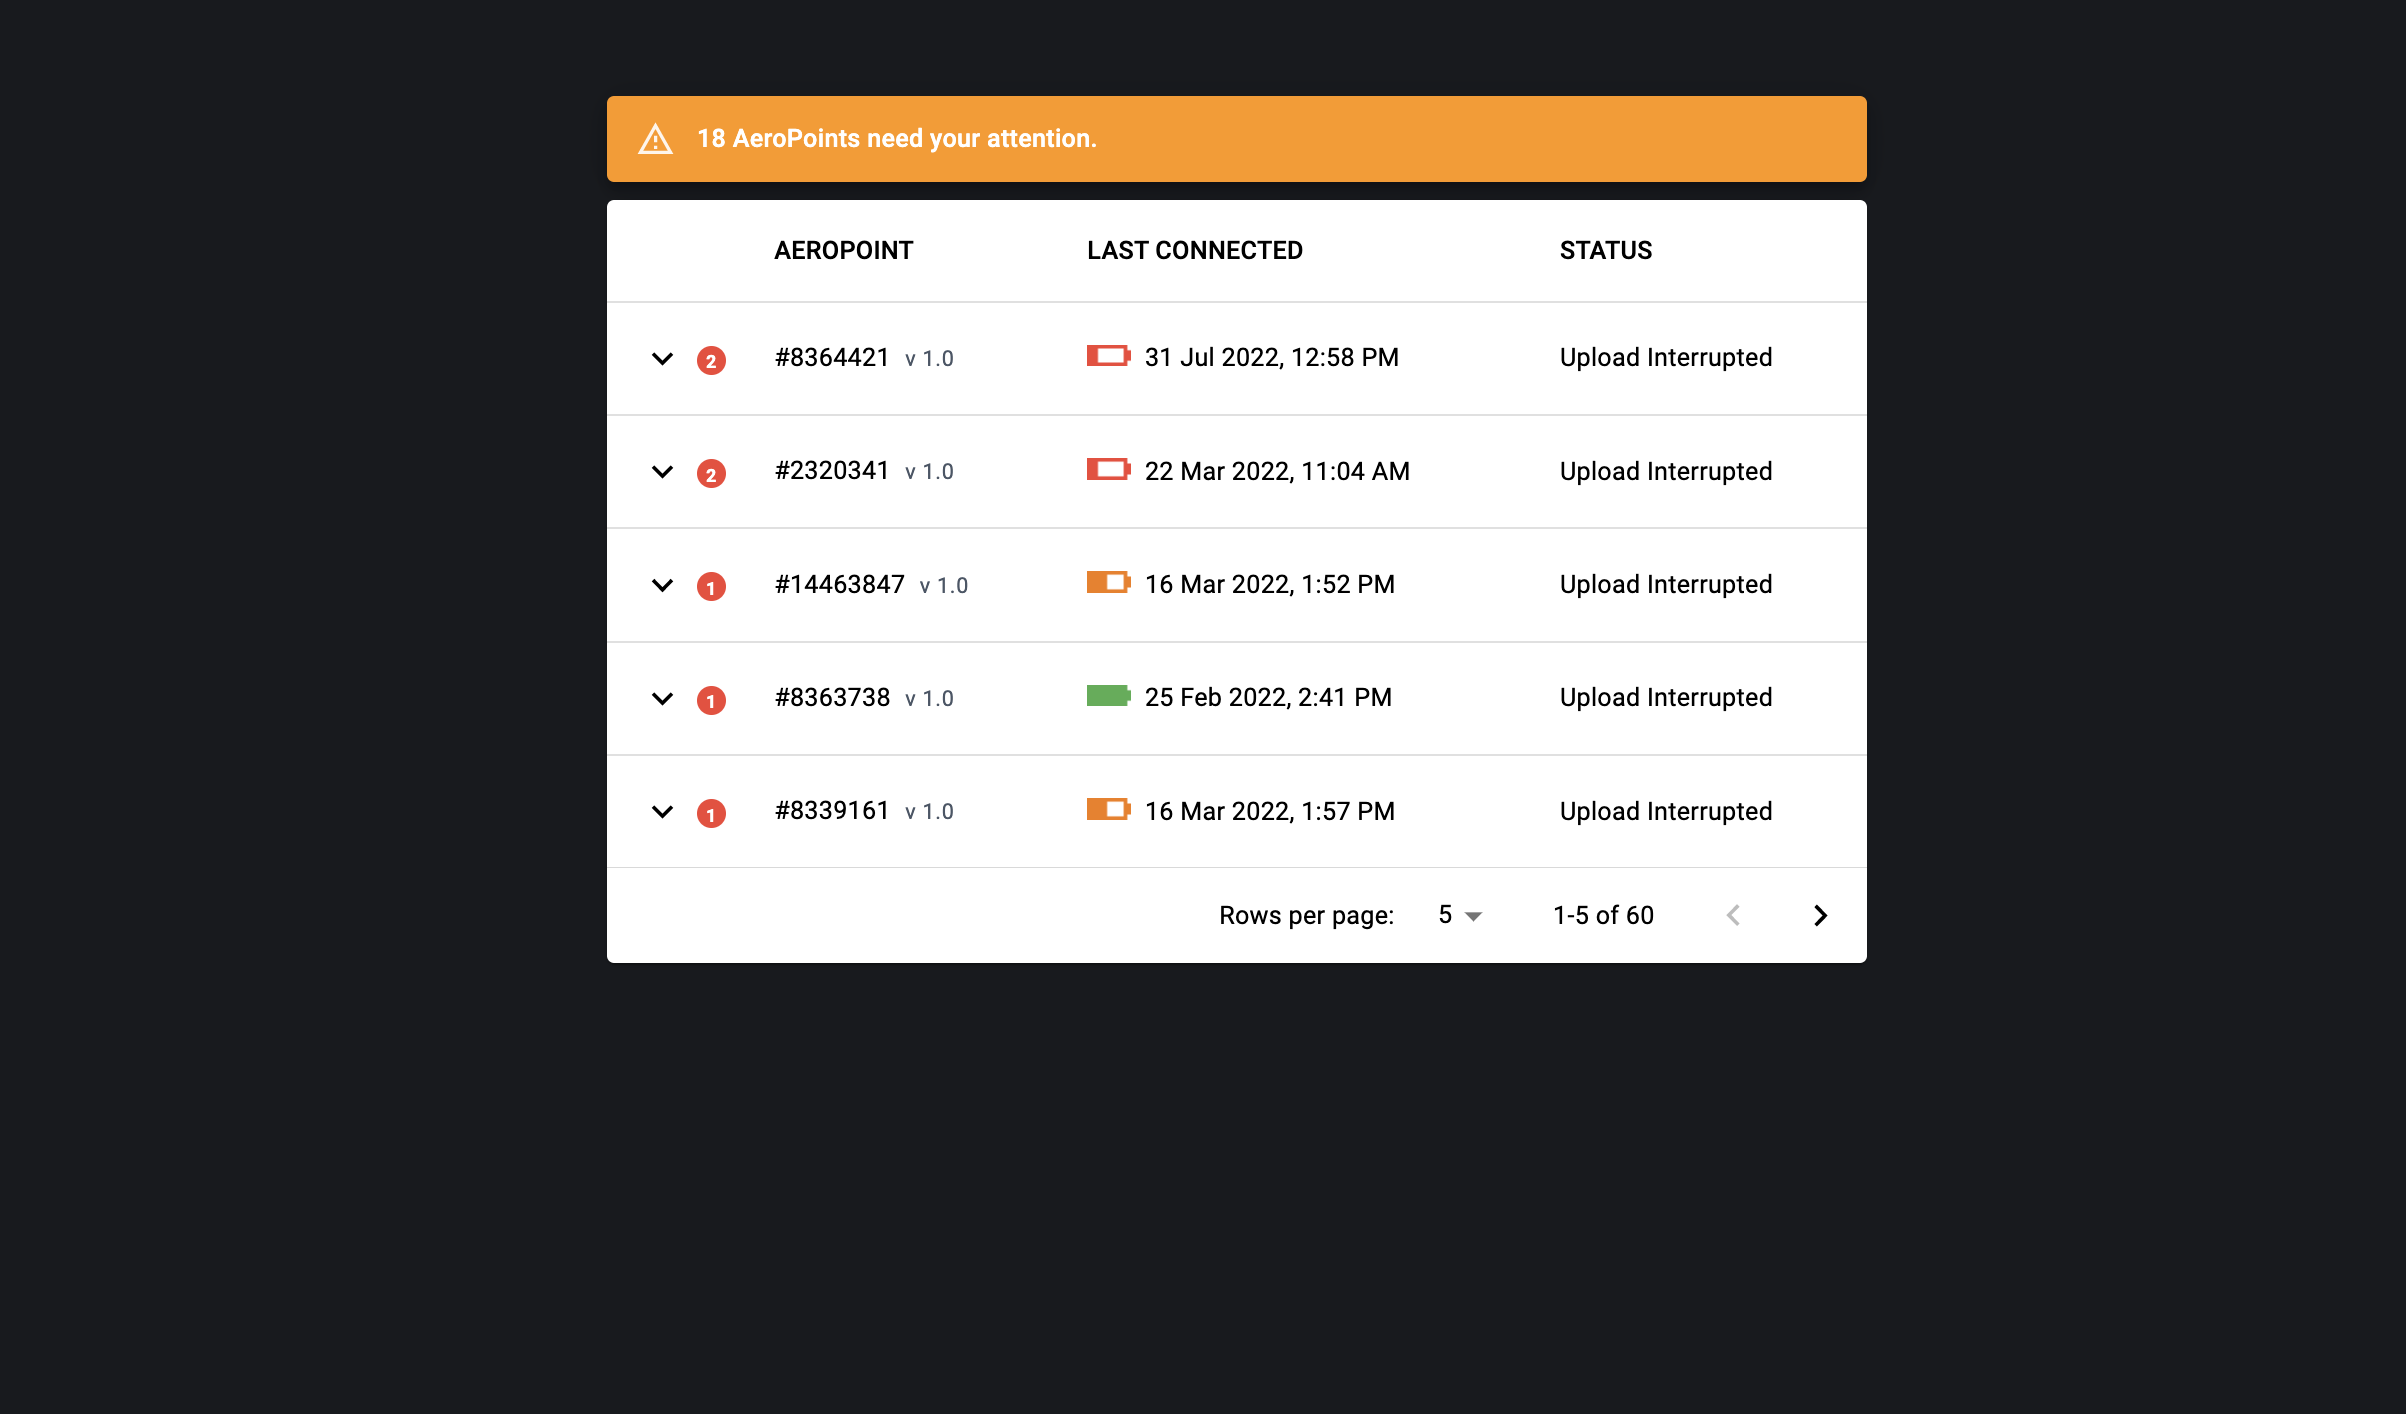
AeroPoints are displayed in a table format.
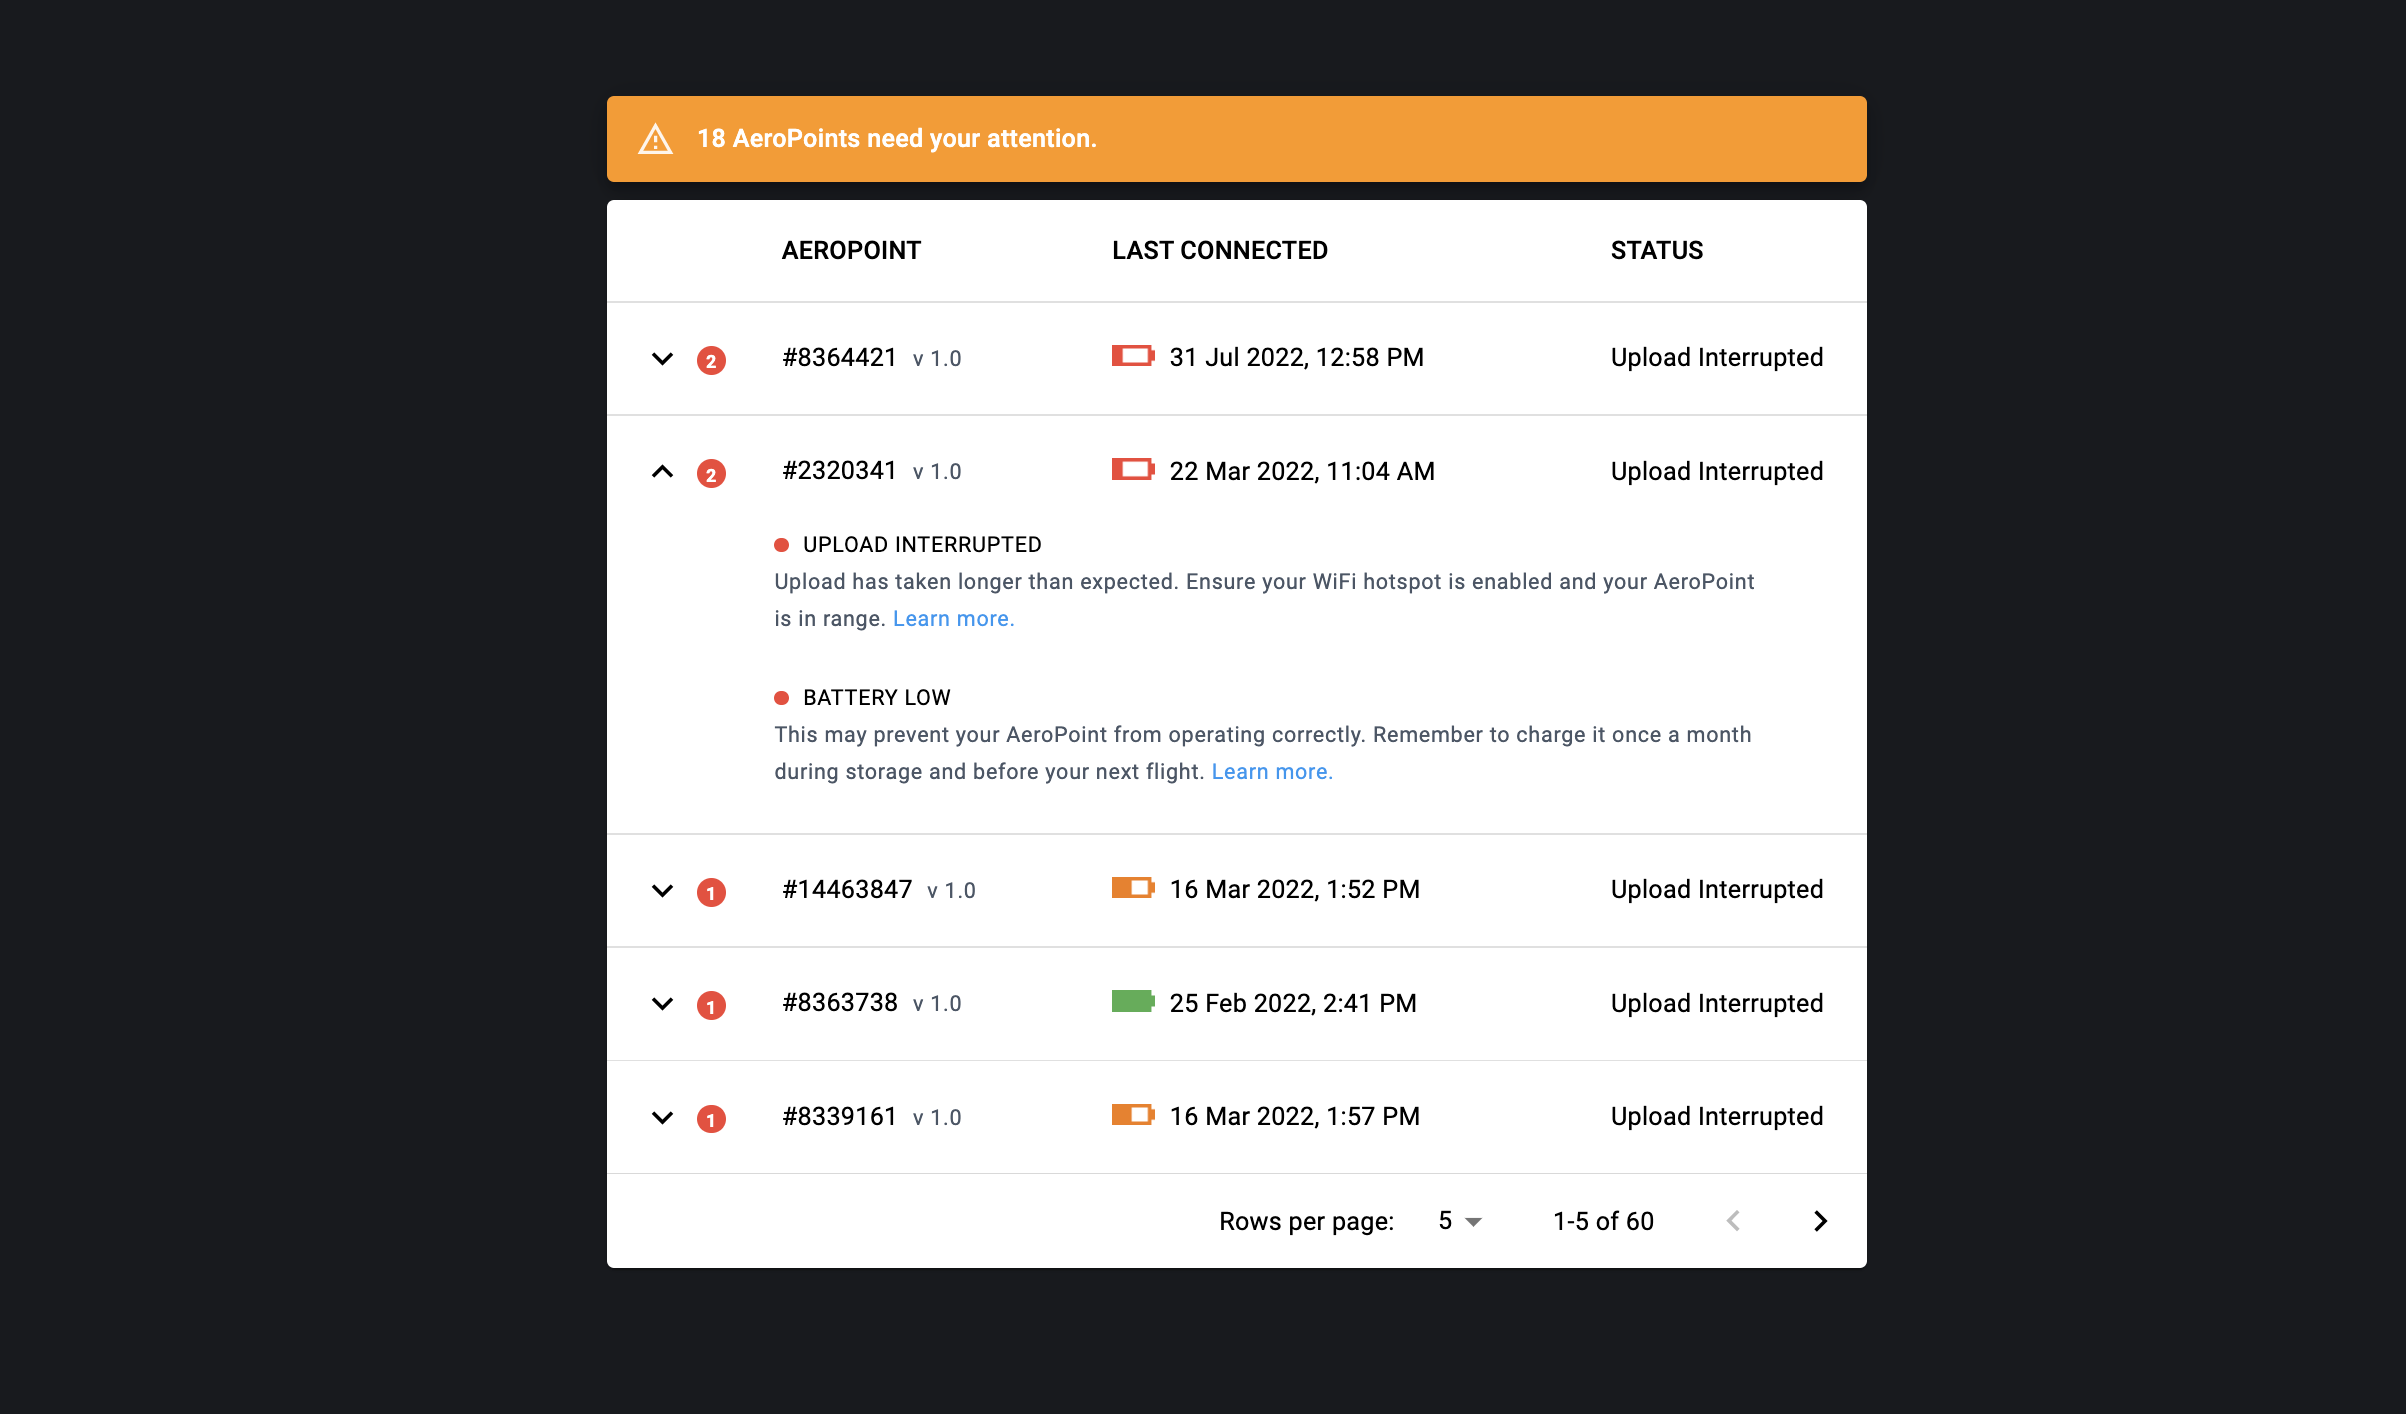
Each row expands to provide diagnostics about the AeroPoint.